"From the dawn of civilization to 2003, five exabytes of data were created.

The same amount was created in the last two days." 

- Google CEO Eric Schmidt


                                                   Yet less than 0.5% of data is ever analyzed and used.

Why is Business Intelligence crucial?

The ultimate goal is  to provide actionable insights that inform better decision-making. 

Decisions that directly affect the bottom line.

A retail company analyzes customer purchase data to discover that sales of umbrellas spike significantly two days before heavy rainfall.

A healthcare institution uses dashboards to visually represent patient admission rates, allowing for better staff and resource allocation.

A manufacturing firm identifies inefficiencies in its supply chain process and streamlines the workflow, reducing lead times.

A telecom company mines call records to identify patterns, discovering that dropped calls often occur in certain geographic areas, signaling the need for more cell towers.

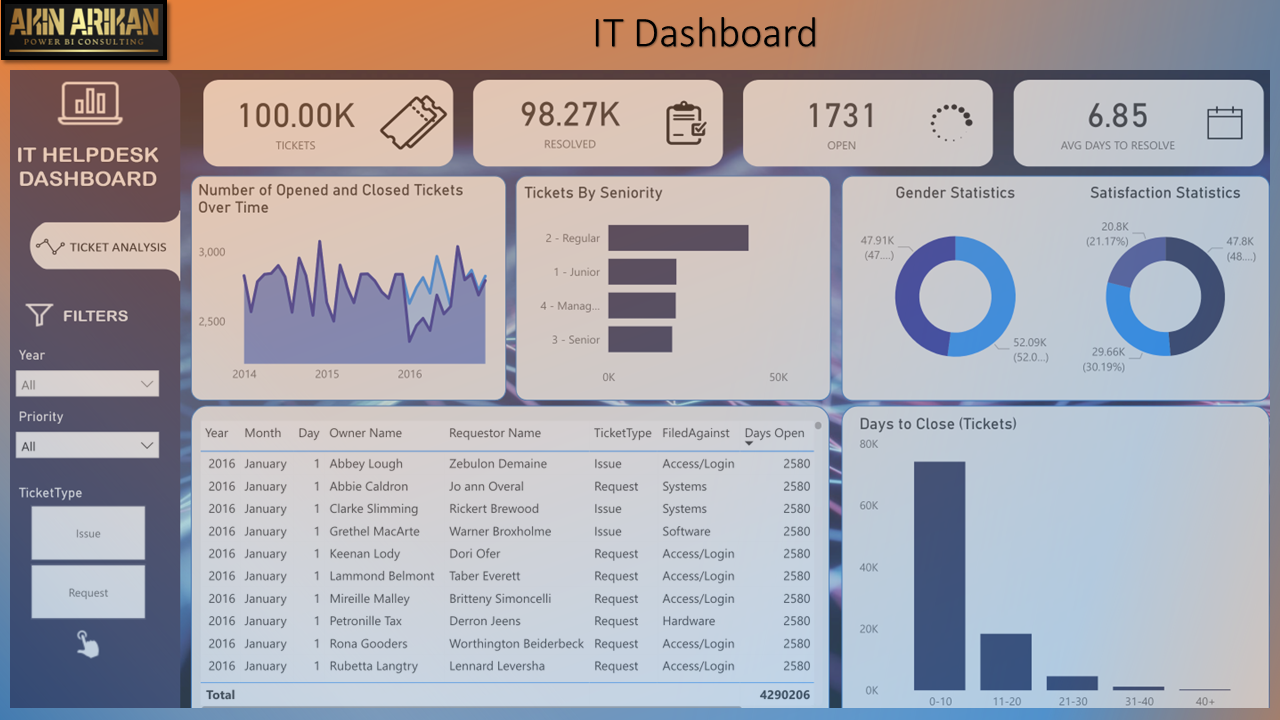
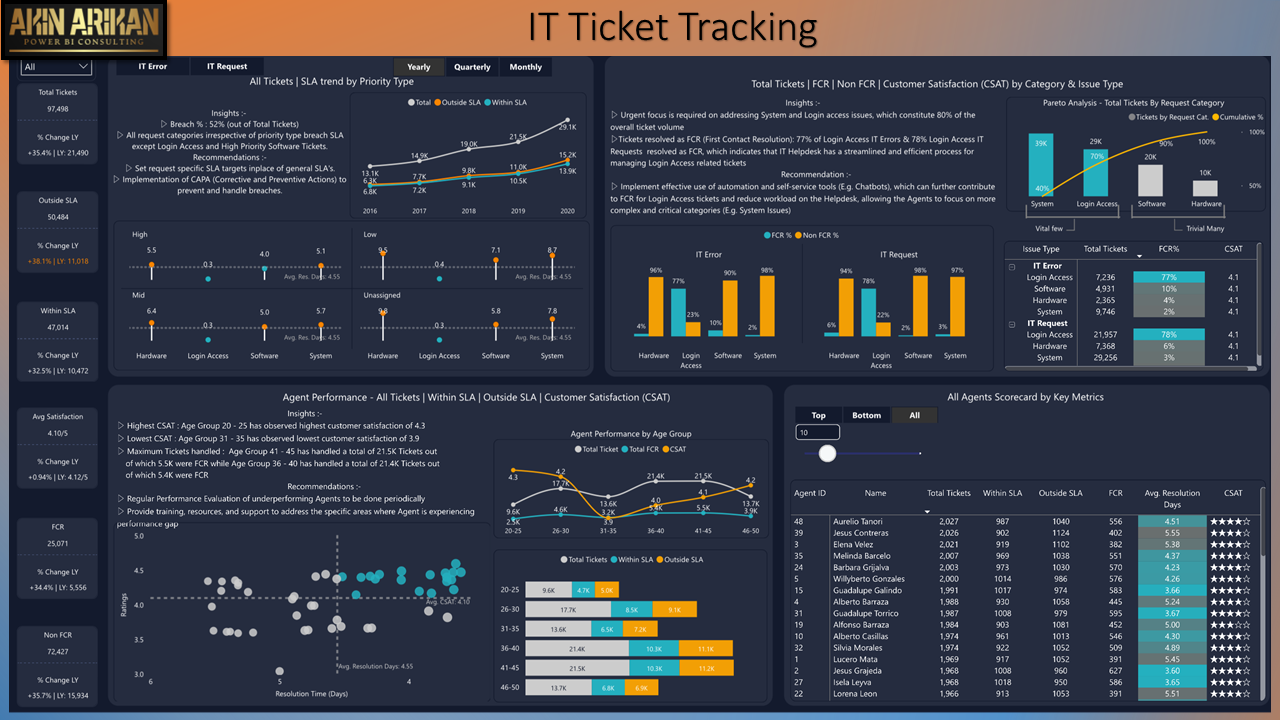
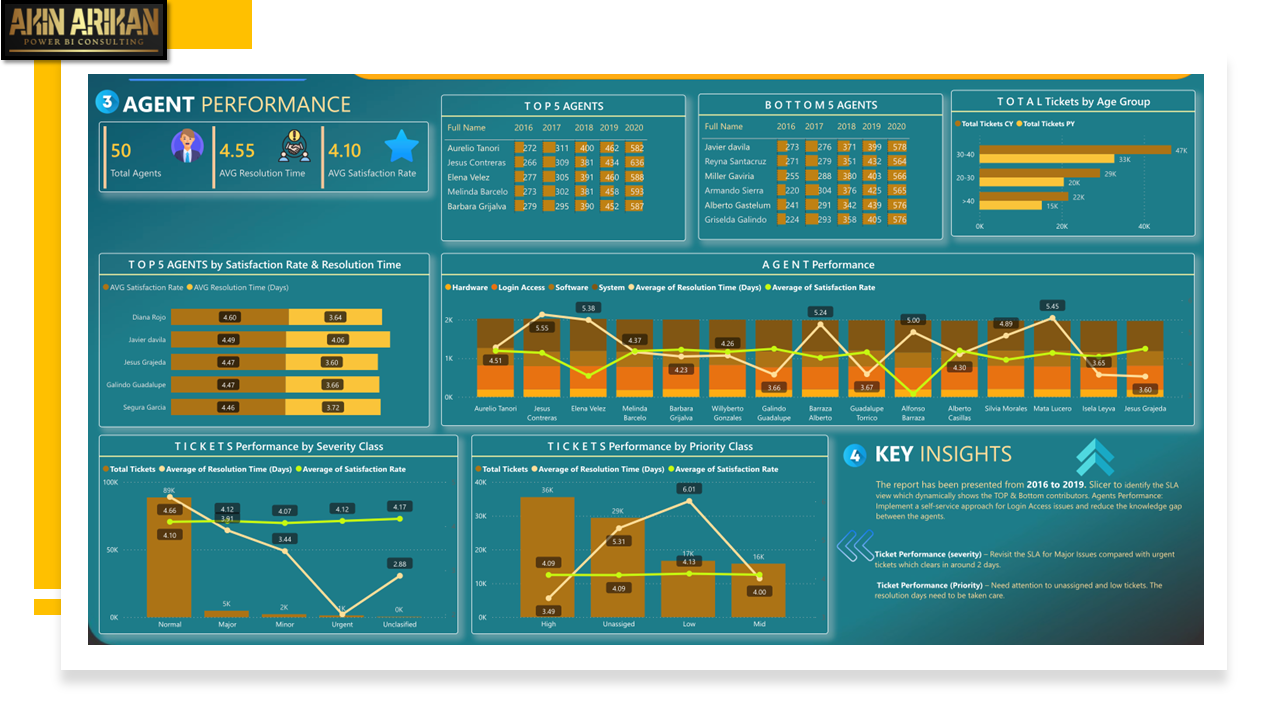
A call center uses BI to measure the performance metrics of its employees, such as call duration and resolution rates, offering training to those who don't meet the standards.

A media streaming company uses BI tools to create detailed dashboards that track viewer habits, such as:

  • Most-watched shows or movies in specific regions or age groups.
  • Peak viewing times during the day or week.
  • The average number of episodes a user watches in a single sitting ("binge-watching").
  • The rate at which viewers drop off from a series (e.g., many start a series but few finish it).

A car dealership identifies which car models are the best sellers in specific months, allowing them to stock more of those models in anticipation.

A restaurant no longer guesses which dishes are most popular but uses data to see which dishes sell out most frequently, adjusting its menu accordingly.

A software company benchmarks its product release cycle times against industry standards to determine areas for improvement.

A bookstore uses BI tools to predict which books will be in high demand during the holiday season, ensuring they have adequate stock.

Disney, with its Disney+ streaming service, can harness the power of BI in various ways. 
Here are some specific examples:


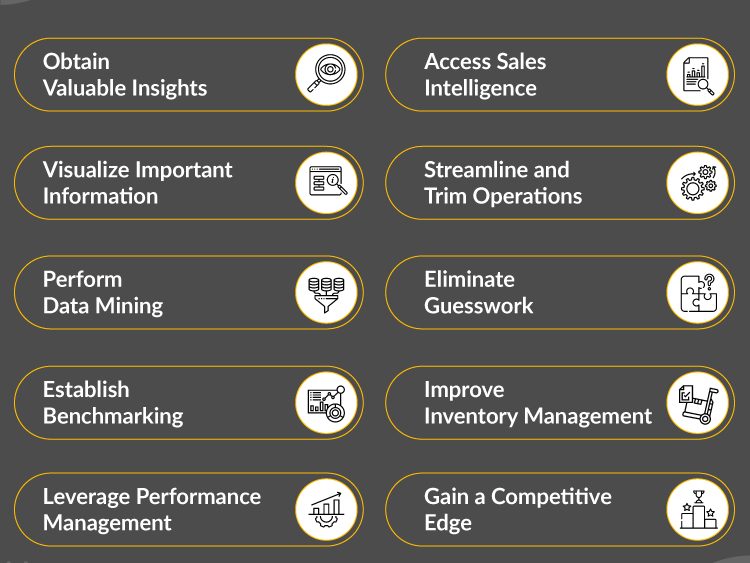
Obtain Valuable Insights

  • Example: Disney+ analyzes viewing data and finds that classic Disney movies are particularly popular among adults aged 25-35, possibly because of nostalgia. This insight can guide marketing campaigns or special promotions targeting this age group.

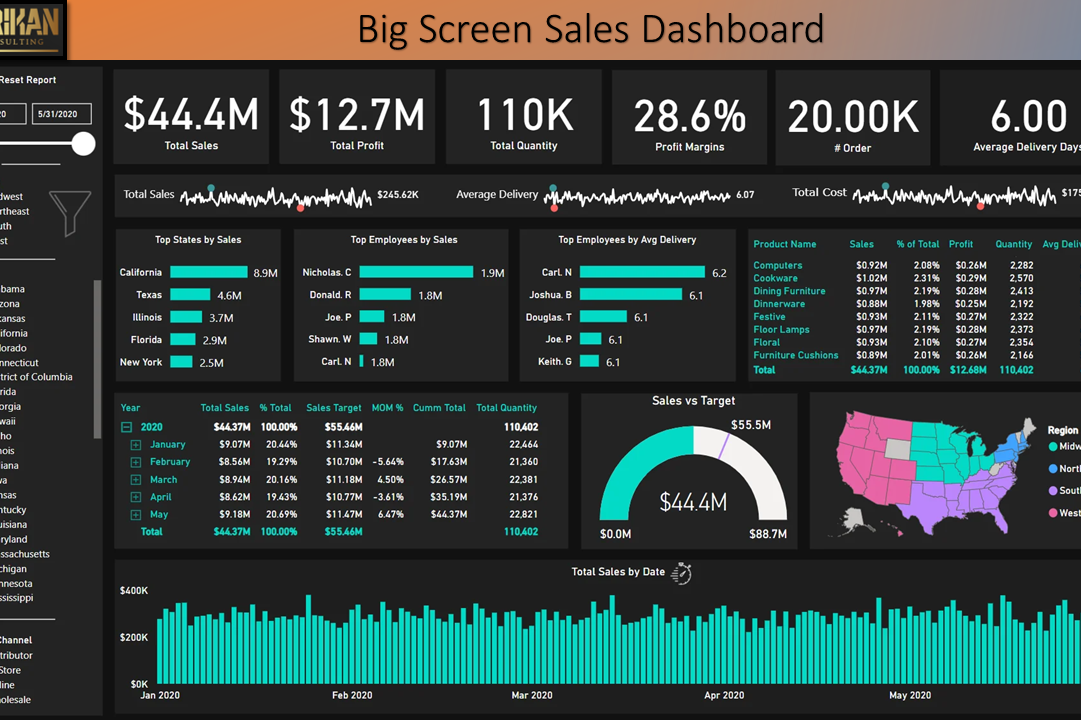
Access Sales Intelligence

  • Example: Disney+ observes a spike in new subscriptions whenever a new episode of "The Mandalorian" is released. They can then strategize release patterns to optimize subscriber growth.

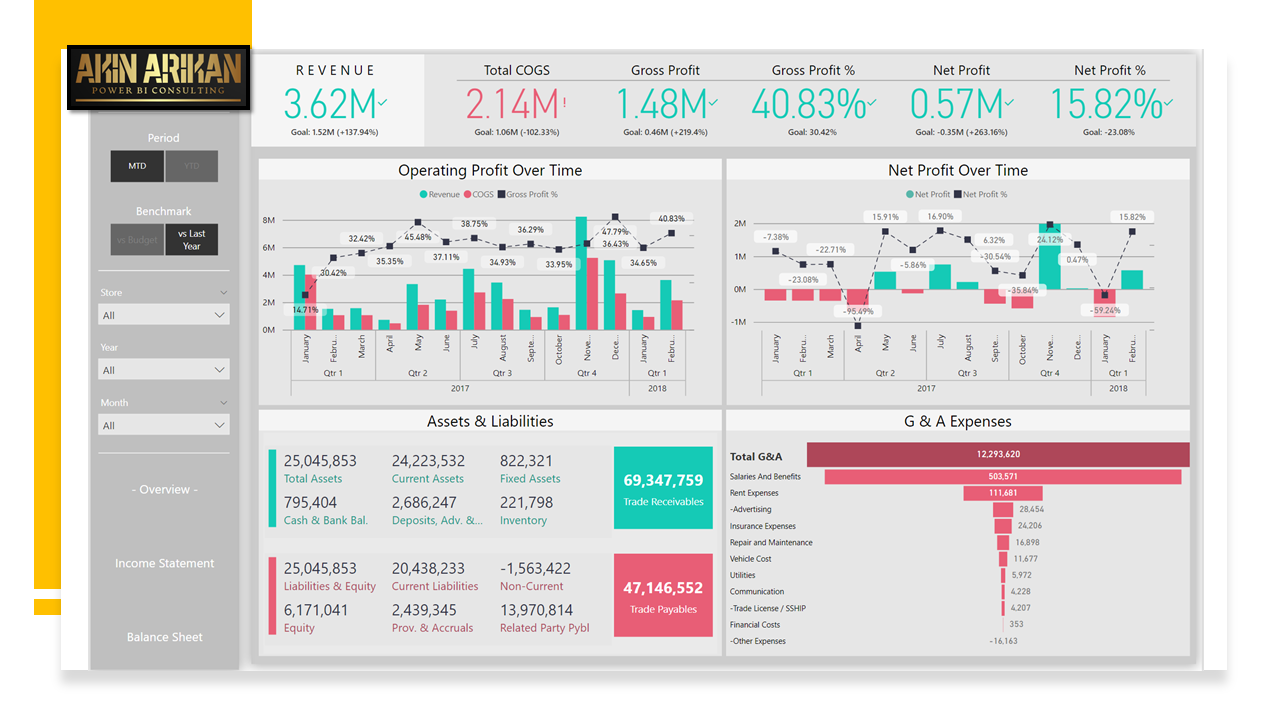
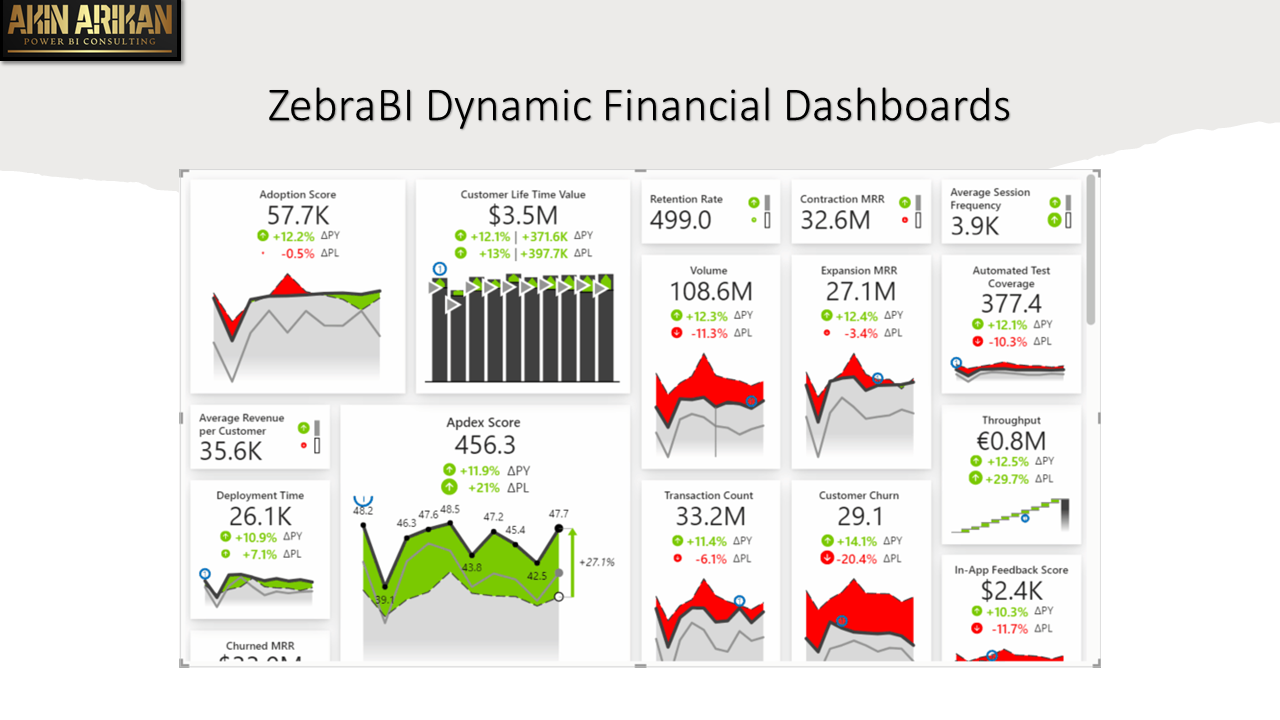
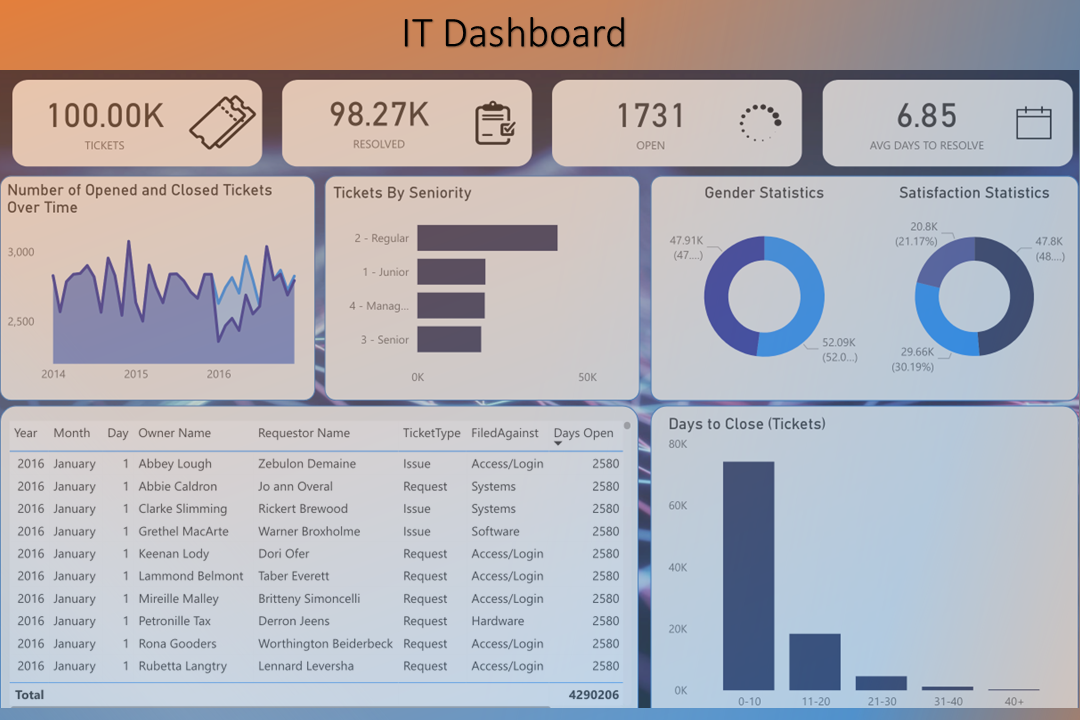
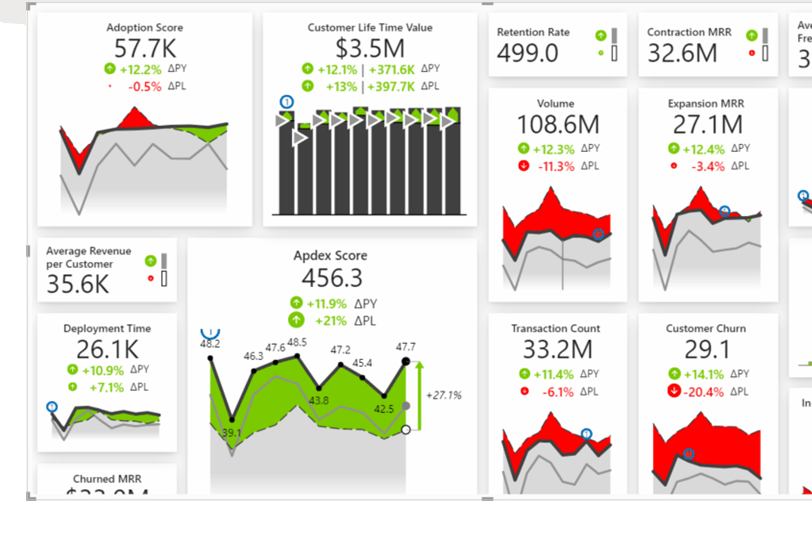
Visualize Important Information

  • Example: Disney+ uses dashboards to show the global spread of their subscribers, highlighting areas where the service is particularly popular or regions where there's potential for growth.

Streamline and Trim Operations

  • Example: By monitoring the streaming quality and buffering issues in real-time, Disney+ can identify and quickly address server problems or enhance the quality of service in high-demand regions.

Perform Data Mining

  • Example: Using data mining, Disney+ discovers that families with young children often watch animated content in the late afternoon. This can influence when new children's content is released or promoted.

Eliminate Guesswork

  • Example: Instead of guessing which genres might be popular, Disney+ can look at data showing that superhero series have high rewatch rates, indicating strong fan engagement and the potential for spin-offs or sequels.

Leverage Performance Management

  • Example: Disney+ evaluates the performance of its customer support through metrics like response time and issue resolution rate, driving continual improvement in user support.

Gain a Competitive Edge

  • Example: Disney+ identifies that exclusive behind-the-scenes content for its Marvel series garners a lot of viewer attention. By producing more of such content, they offer something unique compared to other streaming platforms.

Establish Benchmarking

  • Example: Disney+ benchmarks its subscriber growth against the initial growth rates of its competitors like Netflix or Hulu. This helps them gauge market performance and set realistic targets.

Improve Inventory Management

  • Example: Although in the context of streaming, 'inventory' relates to available content. Disney+ could analyze which content is under-watched or outdated and decide to rotate it out, making room for fresher content that may appeal more to their viewers.

Content Recommendation Algorithms

  • Example: Using viewing history and preferences, Disney+ suggests new series or movies. For instance, if a user frequently watches Marvel movies, they might be recommended a new Marvel series or related documentaries.

User Retention Analysis

  • Example: Disney+ identifies patterns leading to subscription cancellations. If users often cancel after watching a specific series, it might indicate they joined just for that content. Disney can strategize to produce more related content or offer promotions to retain these viewers.

A/B Testing for User Experience

  • Example: Disney+ tests two different user interfaces among a subset of viewers to see which one results in more engagement or longer watch times. The more successful UI can then be rolled out to all users.

Social Media Sentiment Analysis

  • Example: Disney+ analyzes discussions on platforms like Twitter or Reddit to gauge viewer reactions to new releases. Positive sentiment around a new series might prompt more aggressive marketing, while negative sentiment might trigger internal reviews.

Pricing Strategy Analysis

  • Example: By analyzing subscriber growth in relation to pricing changes, Disney+ can adjust its subscription cost, offer special promotions, or create bundle deals (like combining Disney+, Hulu, and ESPN) to maximize revenue and user growth.

Geographical Content Preferences

  • Example: Disney+ notes that Star Wars content is especially popular in certain countries. This insight can guide localized marketing campaigns or even influence the creation of region-specific content.

Device Usage Patterns

  • Example: If Disney+ identifies that a significant portion of its users watch content on mobile devices during morning hours, they might optimize their app for mobile streaming or even release short content snippets ideal for on-the-go viewing.

Feedback Loop Implementation

  • Example: Disney+ creates a feedback system where users can rate and review content. This direct user feedback is invaluable for content development and enhancement.


💻BI dashboards are meticulously crafted reports designed to meet the specific business needs of each organizational unit. 

🗃Leveraging comprehensive data sets, these dashboards are customized to encapsulate all available information relevant to the user's domain. 

🎨The look and feel of each dashboard are tailored to the preferences and requirements of the end user, ensuring a seamless and intuitive experience. 

📊 By combining rich data analysis with personalized aesthetics, BI dashboards empower users to extract actionable insights that drive informed decision-making within their respective areas of operation.

📈 Through the utilization of comprehensive data and customized BI reporting, organizations have seen significant enhancements in key performance indicators (KPIs), such as revenue growth, cost reduction, and operational efficiency.

Who is Akin Arikan?

U.S. Air Force Veteran with 15+ years of enterprise data experience. 

With a passion for data analysis and visualization, I help businesses unlock the power of their data to drive strategic decision-making and improve performance.

I design, develop, and implement Business Intelligence (BI) solutions, transforming raw data into actionable insights. Using advanced tools and techniques, I assist organizations in making data-driven decisions through data analysis, visualization, and reporting.


Here are some of the companies I have had the fortune to work with:

Expertise in Business Intelligence

I have extensive knowledge and expertise in all aspects of Business Intelligence, from data collection and warehousing to analysis and reporting. I stay updated with the latest trends and technologies in the field to deliver cutting-edge solutions to my clients.

Customized Solutions

I understand that every business has unique data needs. I work closely with my clients to understand their business goals and design customized BI solutions tailored to their specific requirements. I ensure that the solutions I deliver align with the organization's strategic objectives.

Actionable Insights

I specialize in transforming raw data into meaningful insights. Through advanced data analysis techniques and visualization tools, I provide actionable insights that enable organizations to make informed decisions and drive business growth.

15+

Years of Experience

100+

Satisfied Clients

50+

Successful Projects

©Copyright    |    SmarterNotHarder.Ai     |    All rights reserved.

We need your consent to load the translations

We use a third-party service to translate the website content that may collect data about your activity. Please review the details and accept the service to view the translations.